
How to Construct an Effective Query in Quantify?
Before you start constructing your query, it's essential to have a clear understanding of your goals. What do you want to get out of this query? Do you want to identify common reasons for negative feedback or determine which features matter most to your customers?
A well-defined objective will help your query construction and make sure your Quantify is focused and relevant.
Now, let's explore the steps involved in constructing a good query in Quantify:
Step 1: Access Quantify
From your Enterpret homepage, click the Quantify tab on the left-hand sidebar.
Step 2: Choose What You Want to Quantify
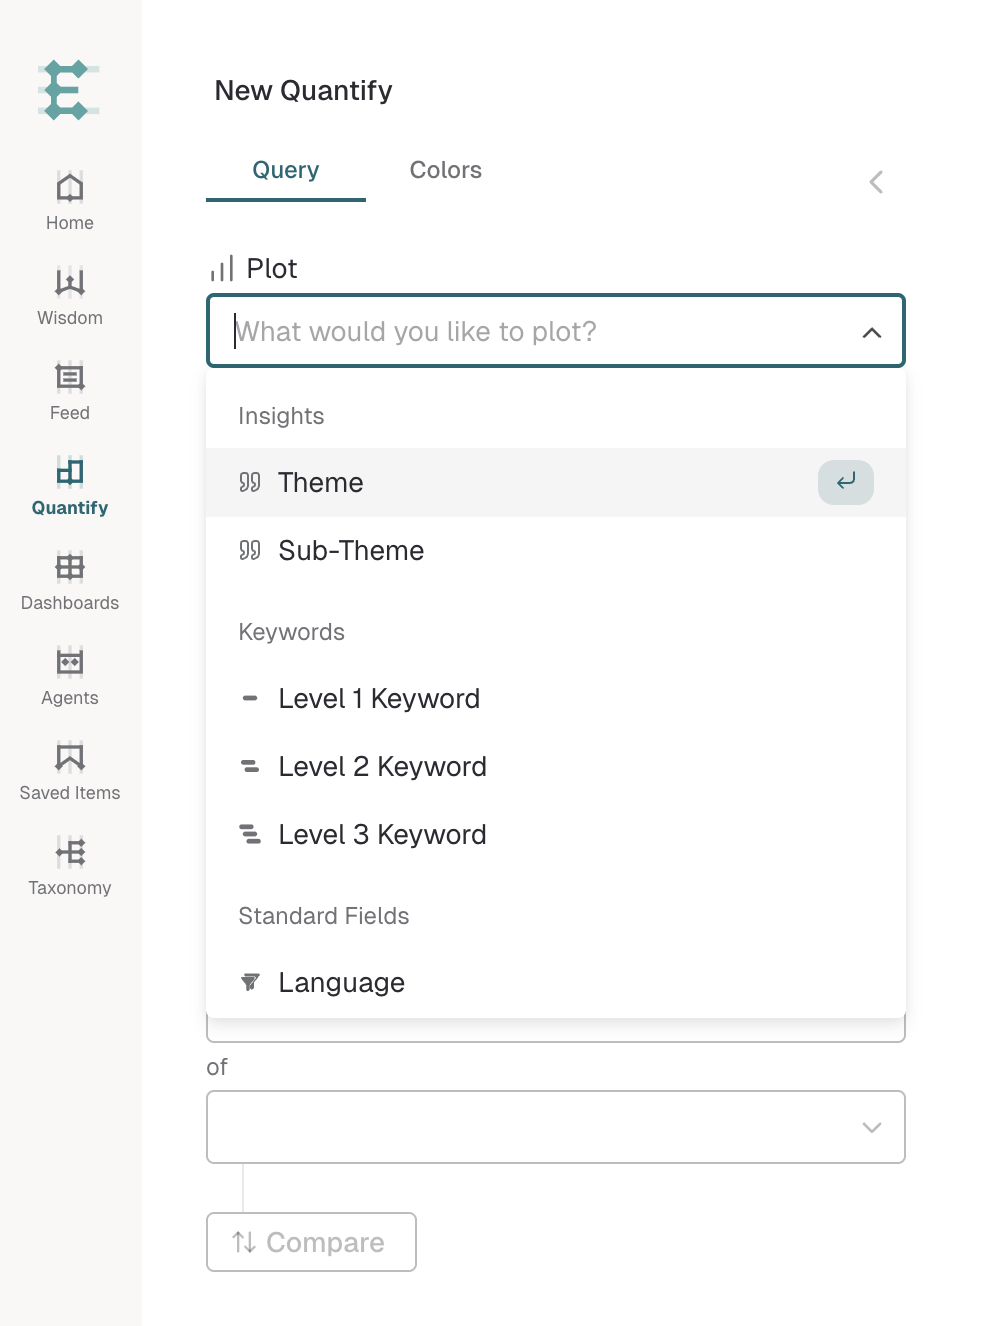
The first option you'll see when constructing a Quanitify is "Plot" in the New Analysis sidebar of the Quantify window.
This is where you choose what exactly you want to quantify: L1, L2, L3, Theme, Sub-Theme, User Sentiment, Feedback Source, Country, Language, and many more.
This is the primary parameter and forms the basis of your query. All the following parameters in your query build on top of this.
Click the "Plot" dropdown and choose from the options to start building your query.
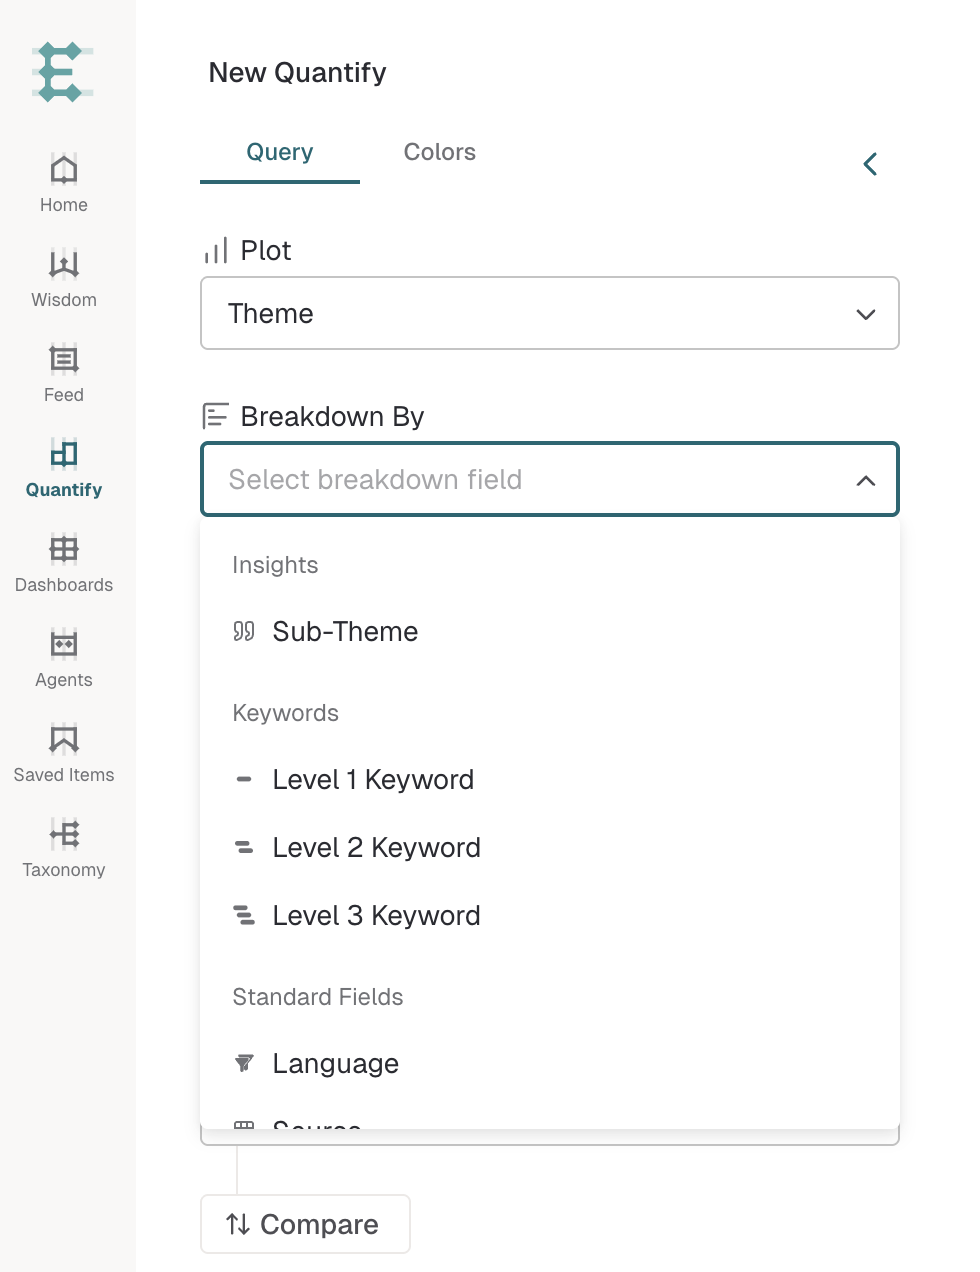
Select "Breakdown By" for <insert use case>
Step 3: Apply Filters
The next option in the New Quantify sidebar is Filters. Filters help refine your query further and make your feedback analysis more focused. Choose from a wide range of options like Taxonomy, Natural language search, Common filters, Source, Integration metadata, and more.
Click the "Add Filter" to open query builder to filter the feedback.
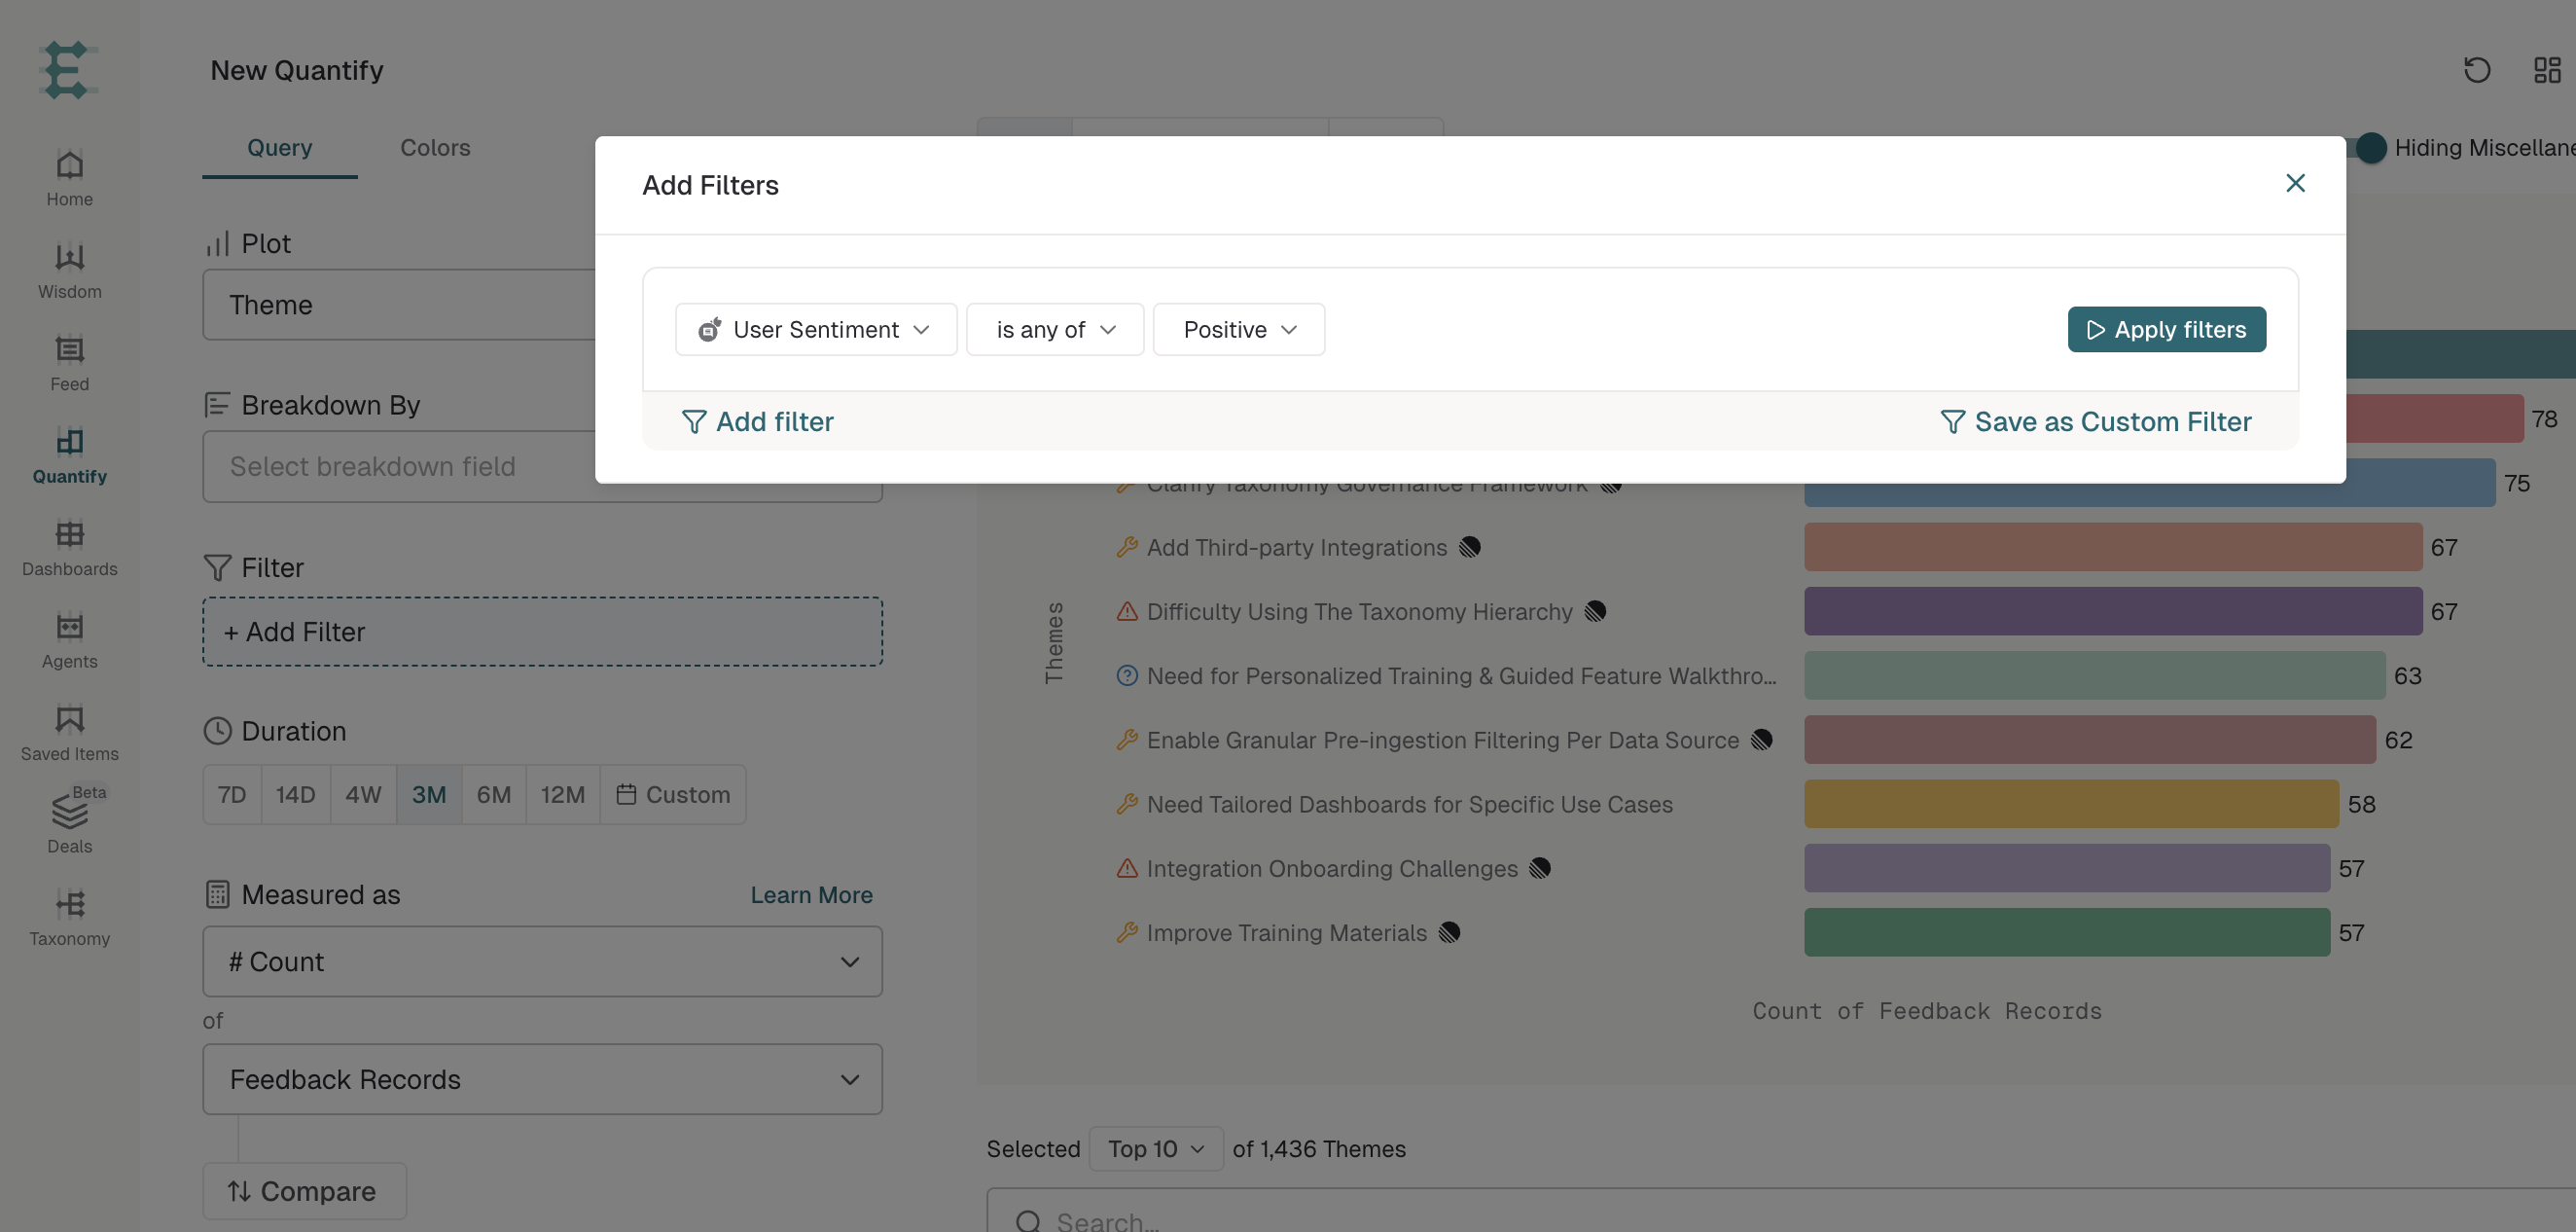
For frequently-used filter combinations, see Custom Filters.
Step 4: Set a Time Range
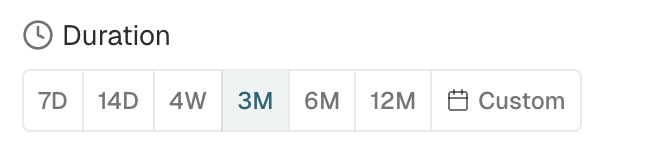
The next parameter in creating your query is "Duration". This lets you narrow down your analysis results to a specific time period. The options include:
Last: Select a range for the last X number of days, like Last 30 Days
Since: Select a range from a certain point in time, like Since March 2023
Between: Select a specific x to y time range, like Between January 2023 to March 2023
Under the Duration option, choose Today, Last 7 Days, 30 Days, 3 Months, 6 Months or 12 Months. Click on "Custom" to input any date range besides the available pre-defined duration options for more flexibility.
Step 5: Visualize Your Report
Now that you have built a baseline query in Quantify, it's time to visualize it for analysis. Enterpret provides various visualization options, such as bar graphs, trend lines, or statistical graphs, to present your feedback data effectively.
You can navigate to the right side of your Quantify window, beside the New Quantify sidebar, and choose your preferred visualization option.
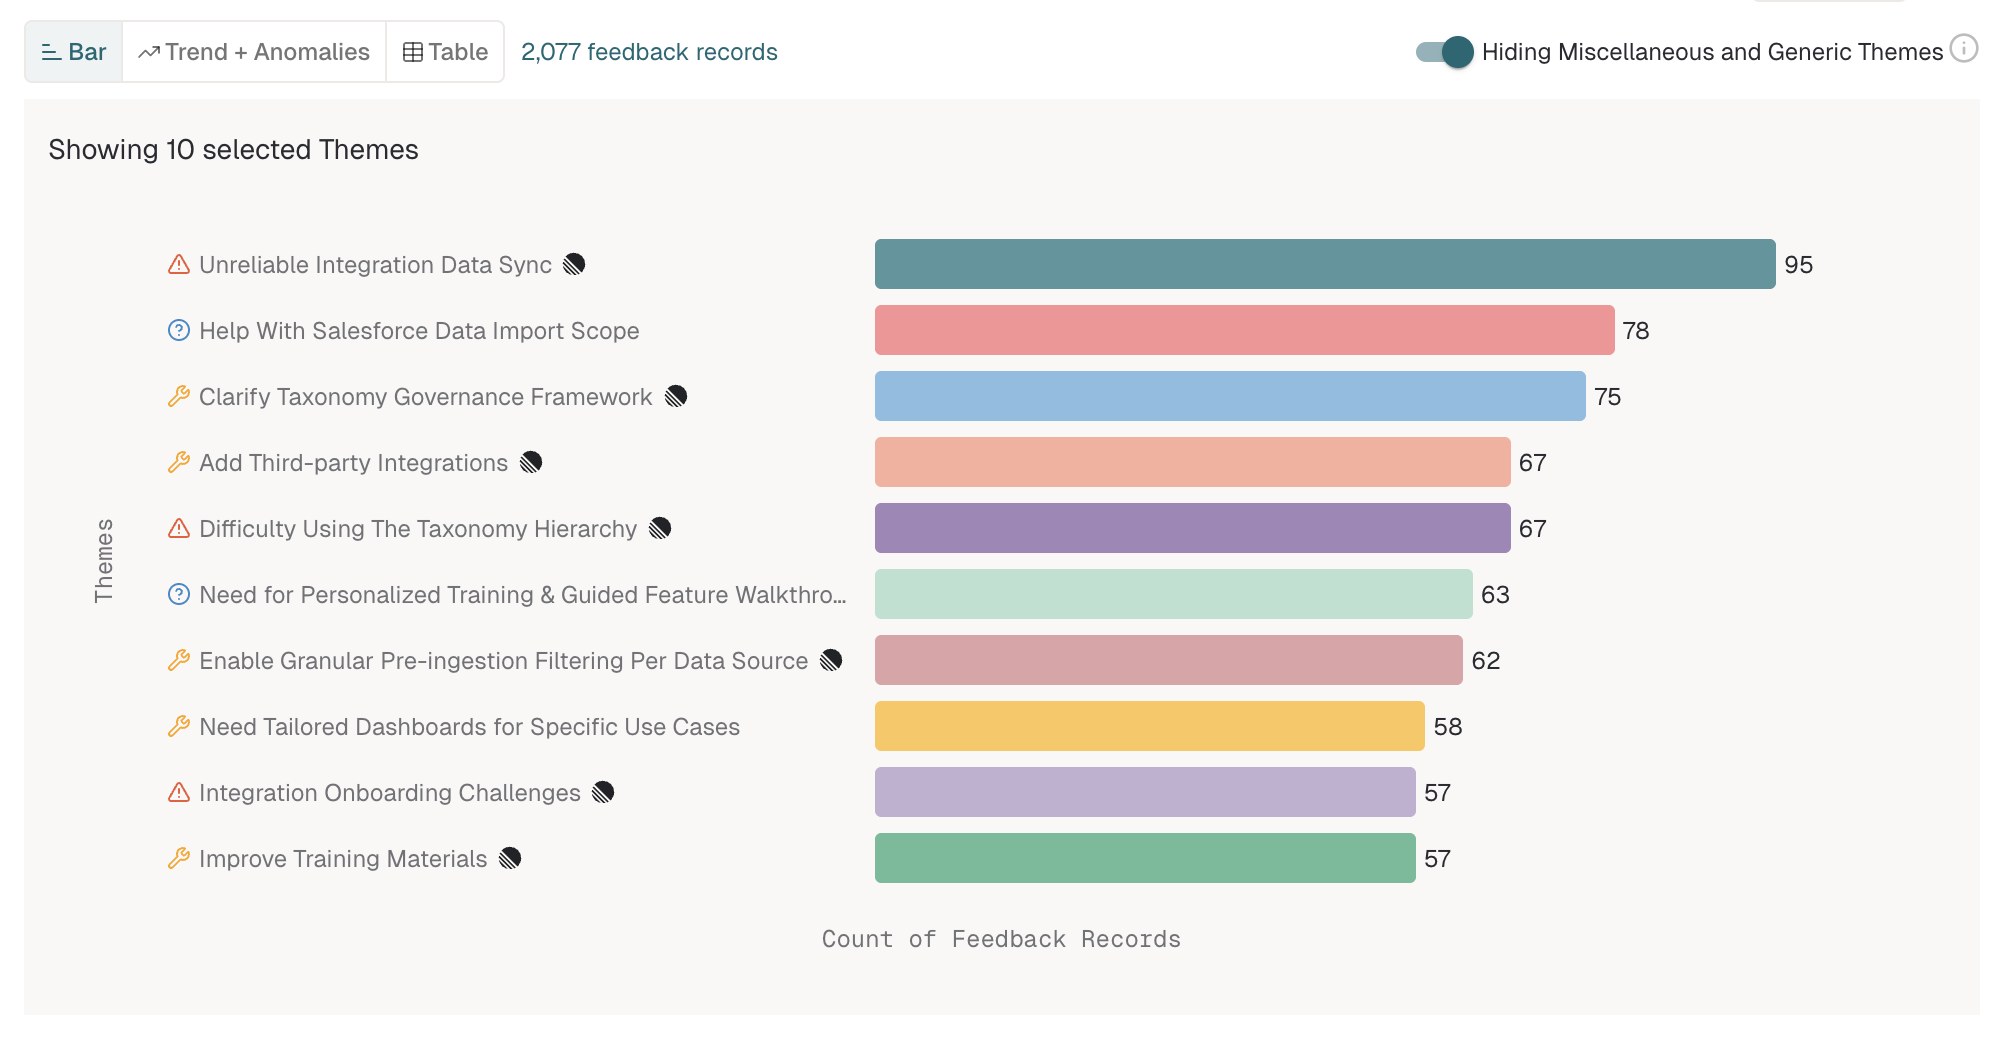
For details on Bar charts and Trends + Anomalies, see Anomalies & Visualisations on Quantify.
Step 6: Select Values to Visualize
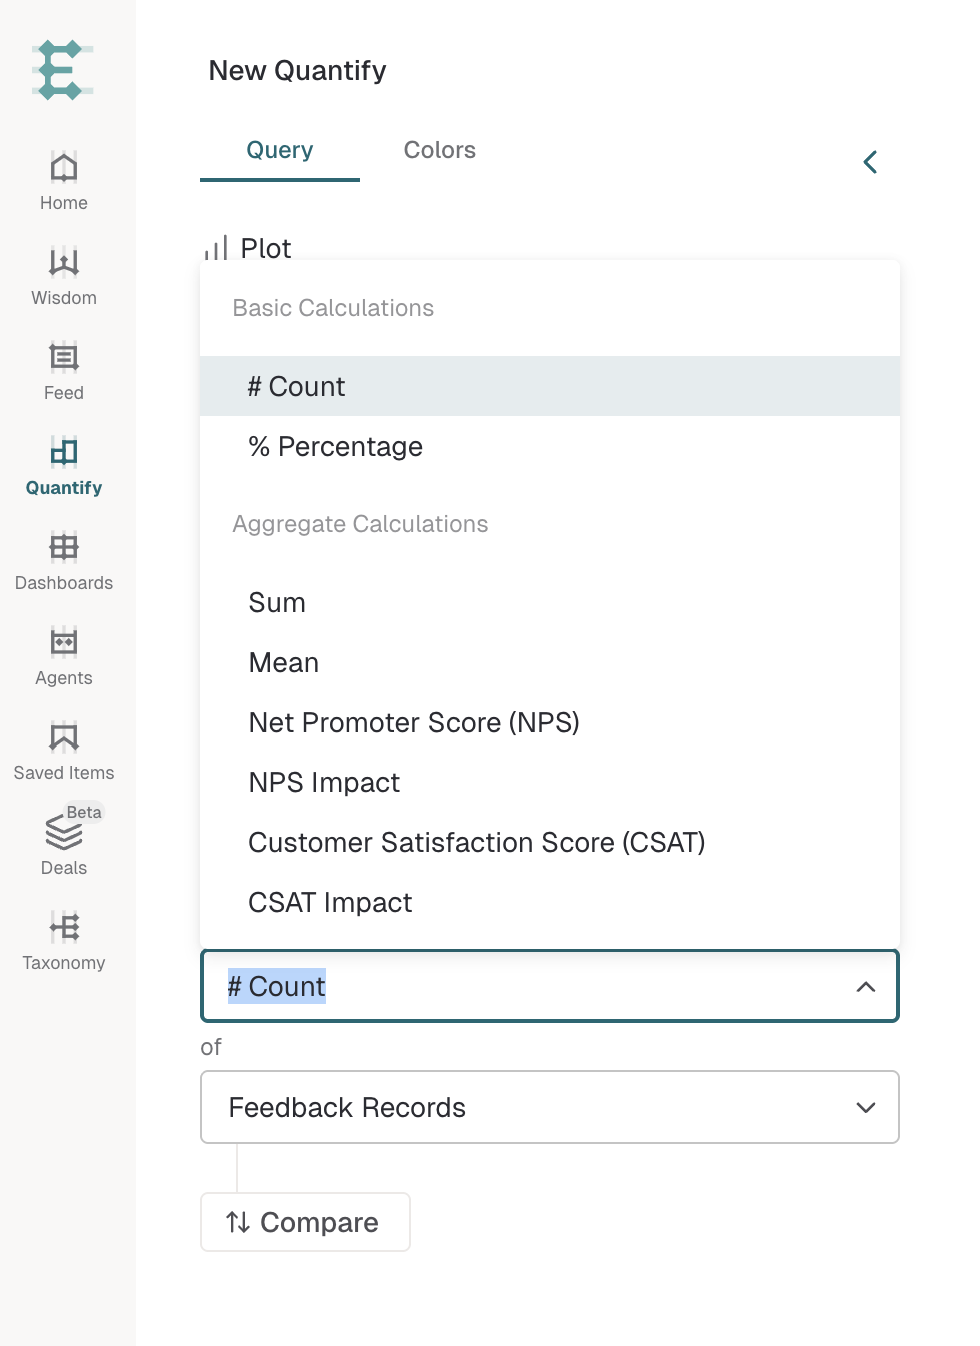
By default, Enterpret displays feedback records in descending order of mentions of Theme, Sub-Theme, or another parameter you chose in Step 1.
To change this default value, find Measured as at the bottom of the New Quantify tab and choose your preferred value.
Find more at Quantify Query | Help Center
Conclusion
An effective query in Quantify is specific, clear, and focused on the aspects of your customer feedback data that matter most to you. By following these steps, you can create an effective query that will help you extract actionable insights from your customer feedback data.